About the Project
As the only UX designer at Enlyft, I took full ownership of this project, working closely with the Lead Product Manager from initial research to final UI delivery. I also collaborated with the CEO, engineers, and sales team at different stages. The project spanned multiple quarters, with several sprints and milestones, and this case study highlights the final result.
About the Company
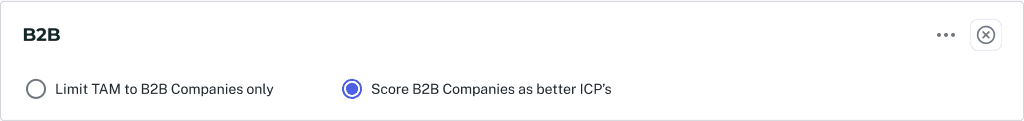
Enlyft helps B2B companies find new customers by providing access to data on millions of businesses and their employees. Companies can use Enlyft’s powerful features to find businesses and contacts that match their ideal customer profile, making it easier to target the right audience.
The primary users of Enlyft’s are Sales and Marketing teams at B2B companies
Understanding the Problem Space
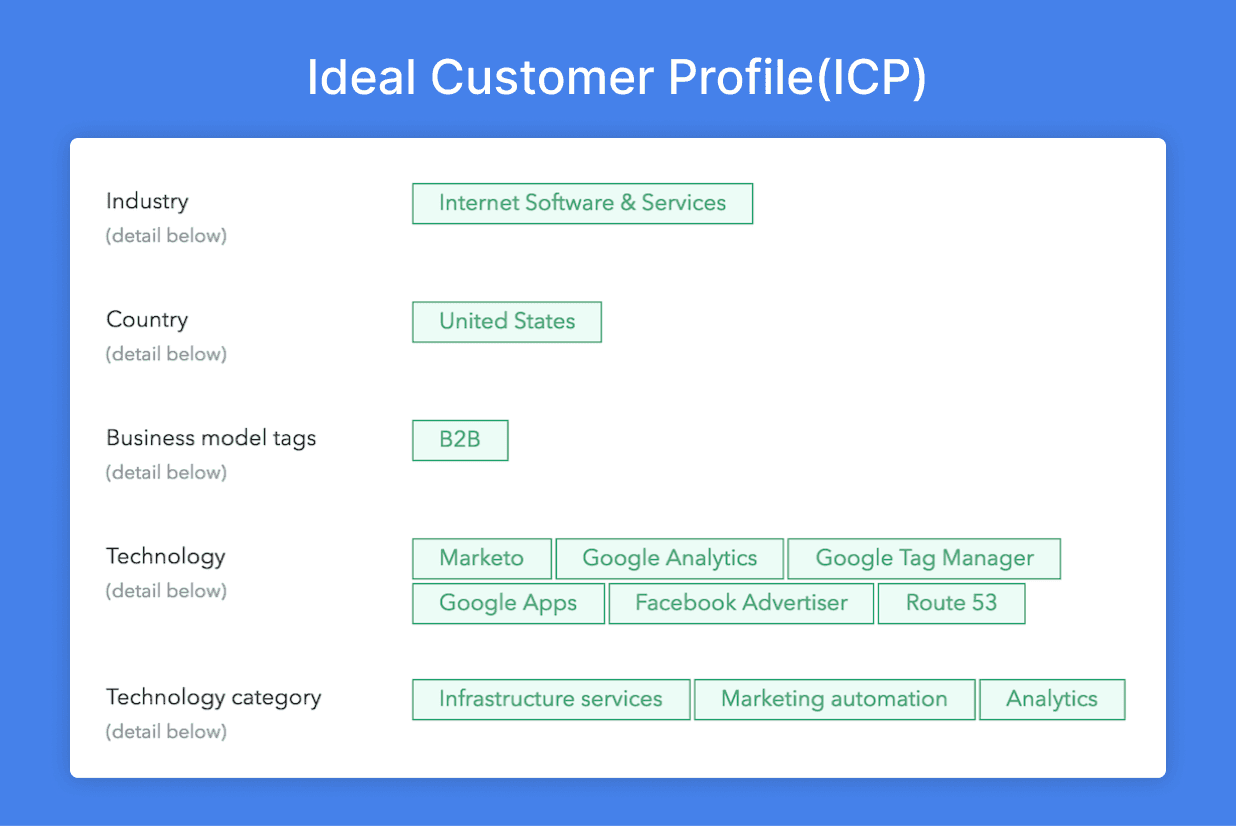
Businesses often need to identify and focus on the customers most likely to buy their product or service. To do this, they create an Ideal Customer Profile (ICP)—a description of the "perfect" customer based on factors like company size, location, industry, or technology used.
Consider Microsoft Power BI as an example. Here’s how a hypothetical Total Addressable Market (TAM) and Ideal Customer Profile (ICP) might be defined:
TAM: All mid-sized to large enterprises globally that need data visualization and business intelligence solutions.
ICP: Companies in the Financial Services and Healthcare sectors, with 500+ employees, already using Microsoft Azure or Office 365.
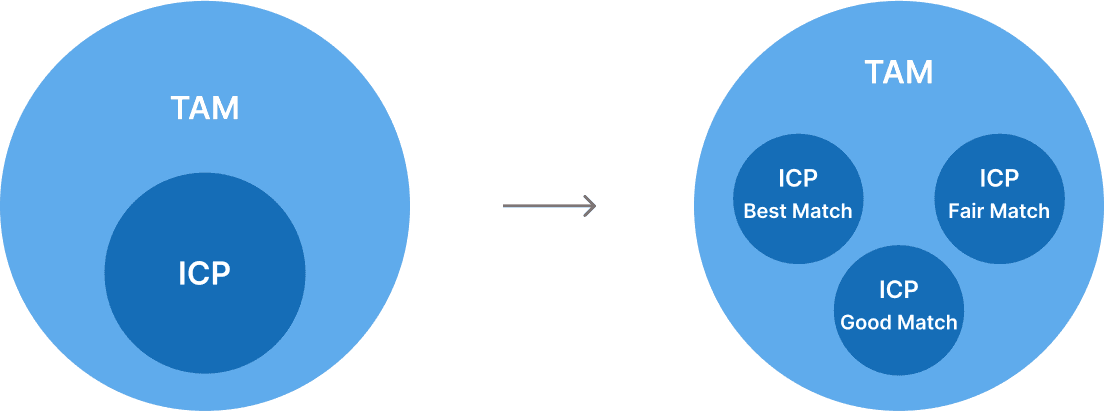
But with so many potential customers out there, it’s hard to know who to prioritize. That’s where scoring comes in. Scoring assigns a rank (like High, Medium, or Low) to potential customers based on how closely they match the ICP. This helps businesses focus their time and energy on the best opportunities.
Requirements
These are the key requirements I received from the Product Manager and CEO for this project:
TAM and ICP Definition: Allow users to define their Total Addressable Market (TAM) and Ideal Customer Profile (ICP).
Account Ranking: Rank accounts based on the TAM and ICP setup.
Score Preview: Enable users to preview account score immediately after defining their TAM and ICP, making it easy to fine-tune the setup.
Score Transparency: Show users why each account receives its specific score to build trust and provide transparency.
Recommendations: Allow users to upload their existing customer lists and provide tailored recommendations to refine their TAM and ICP setup based on the characteristics of their current customers.
Research
Competitive Analysis
Internal Discussions
Brainstorming and Ideation
Solution
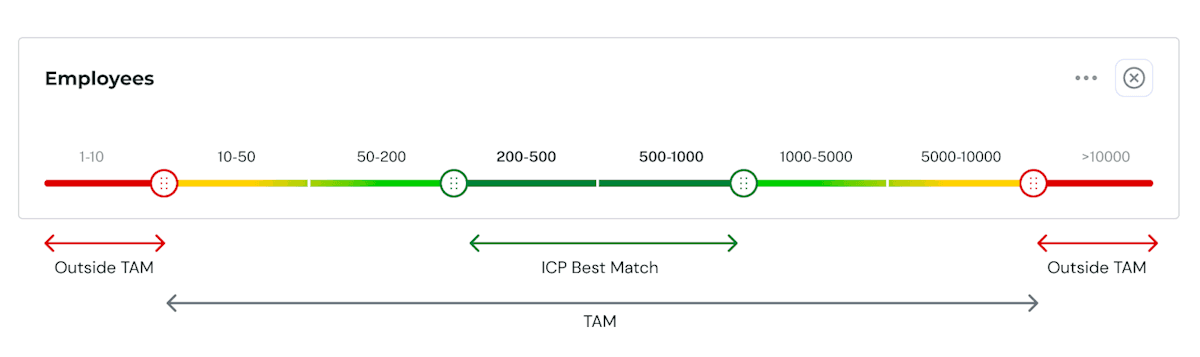
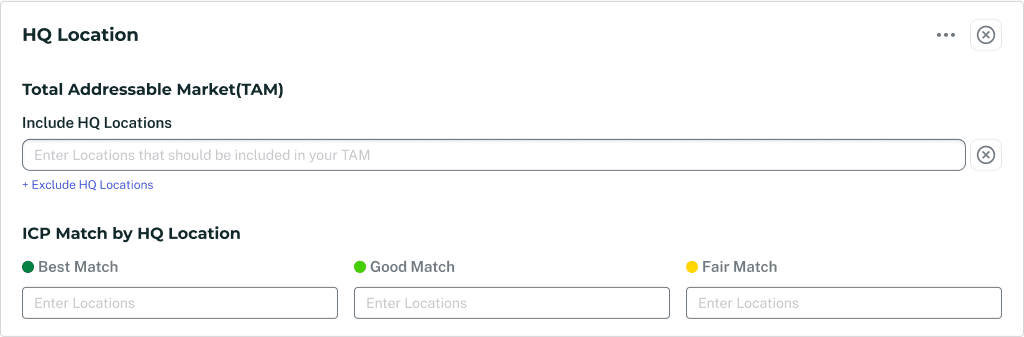
Account Fit Setup
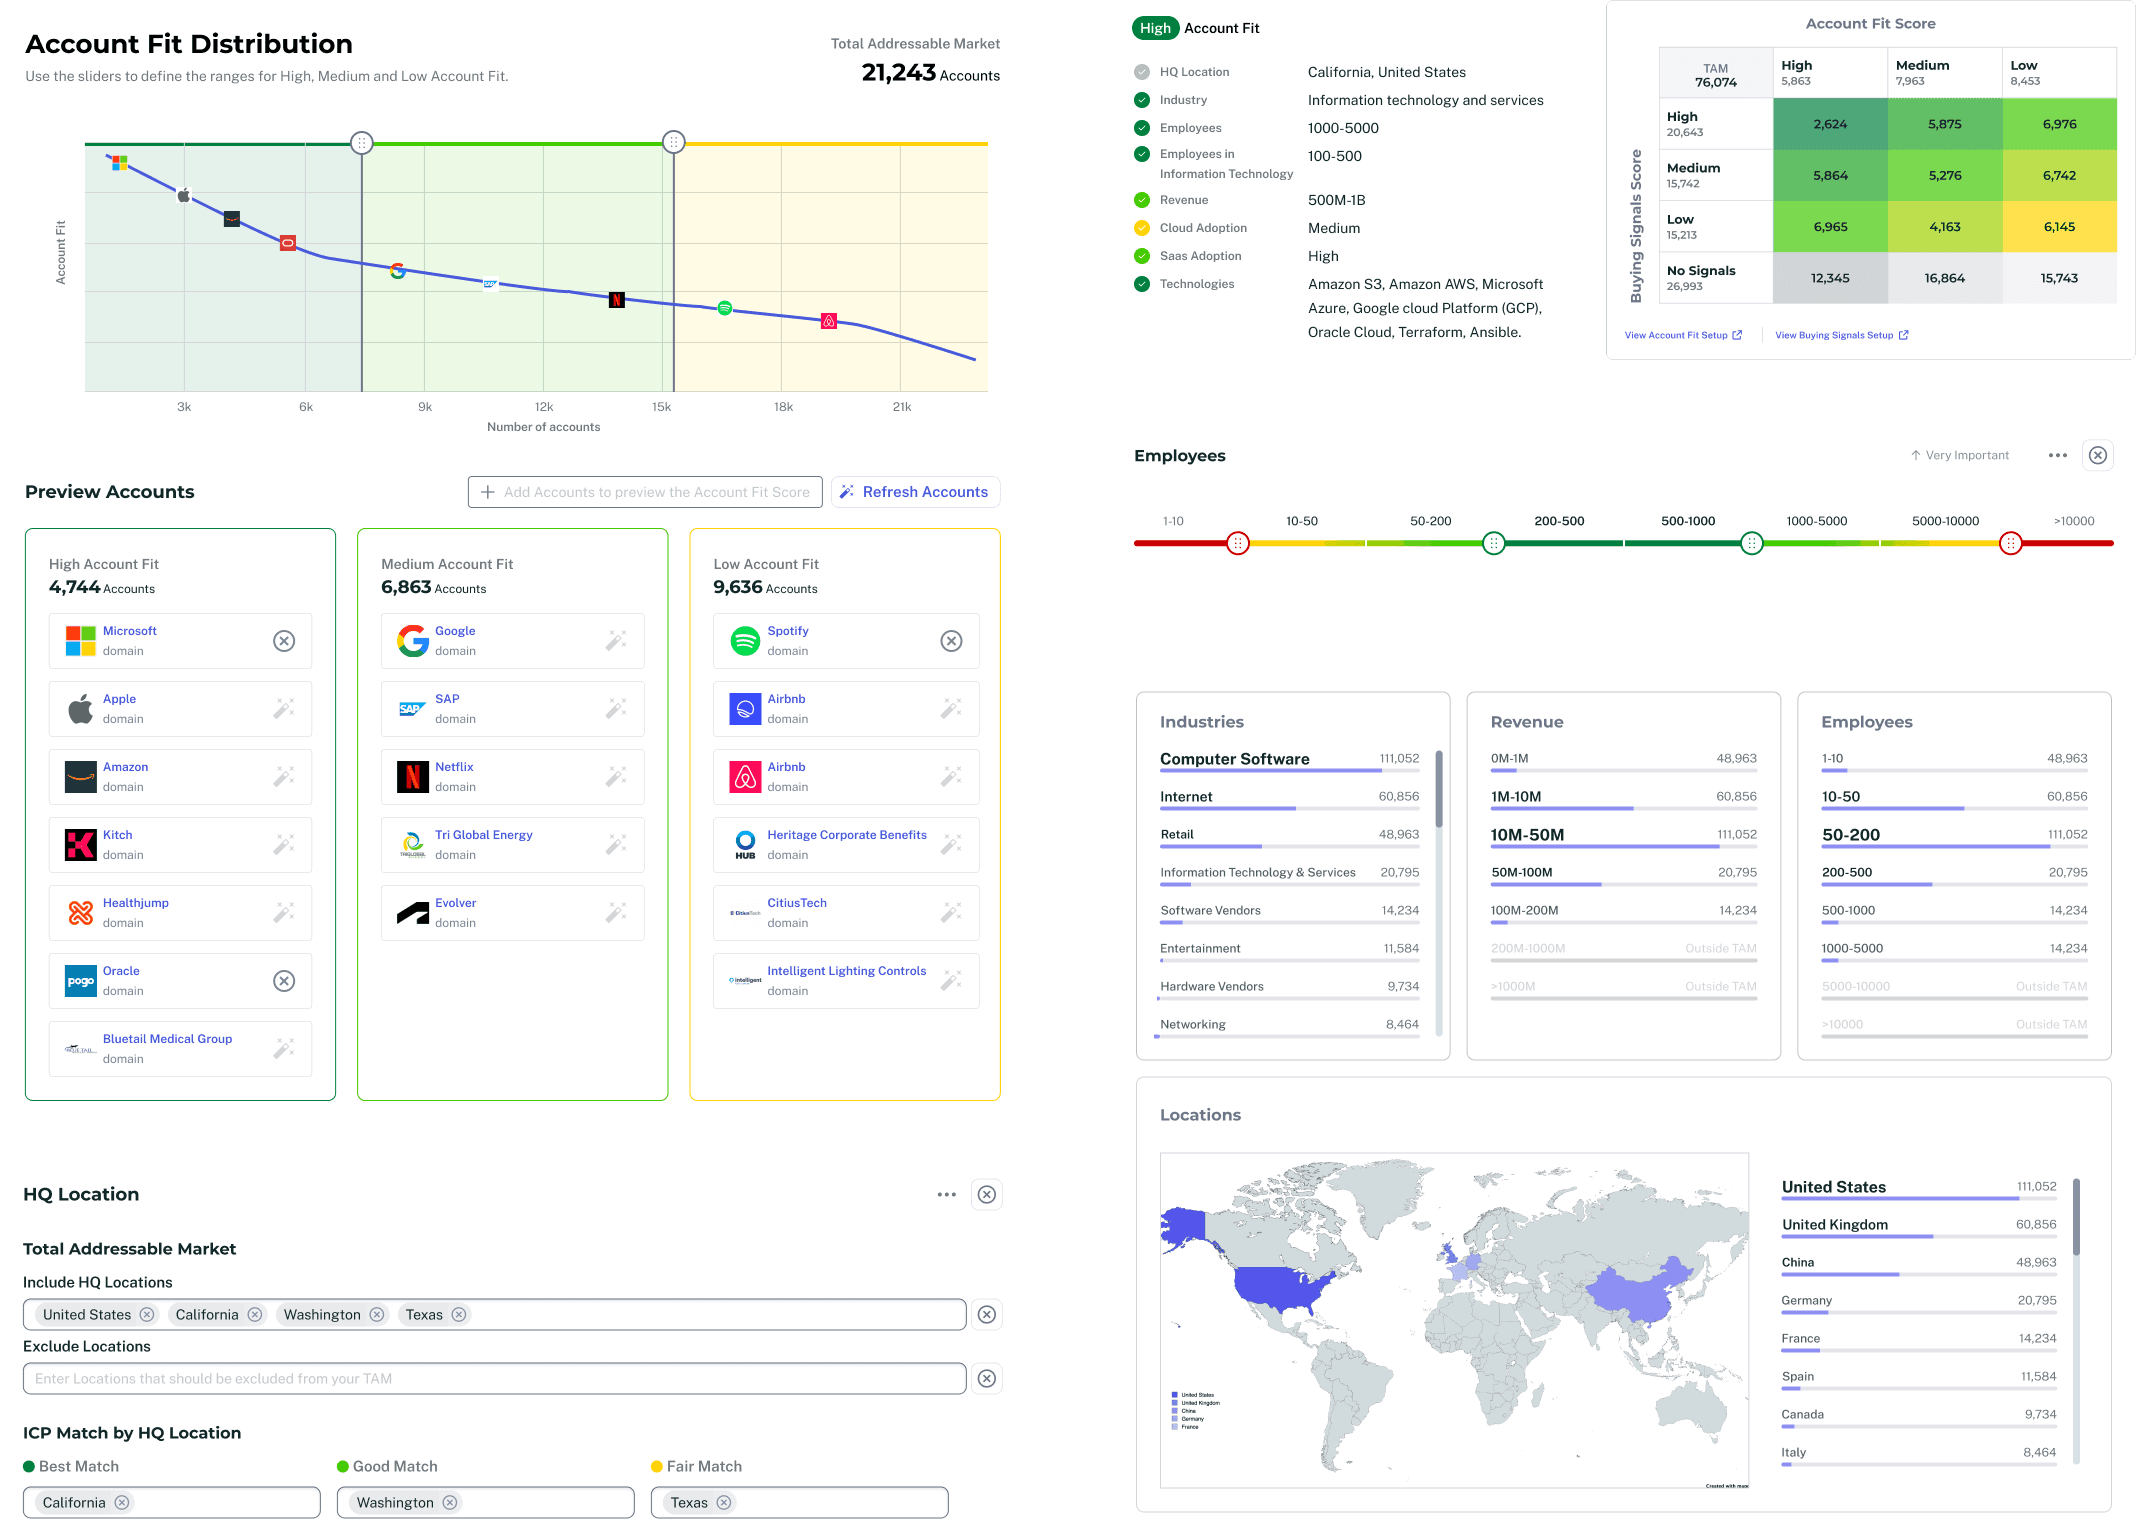
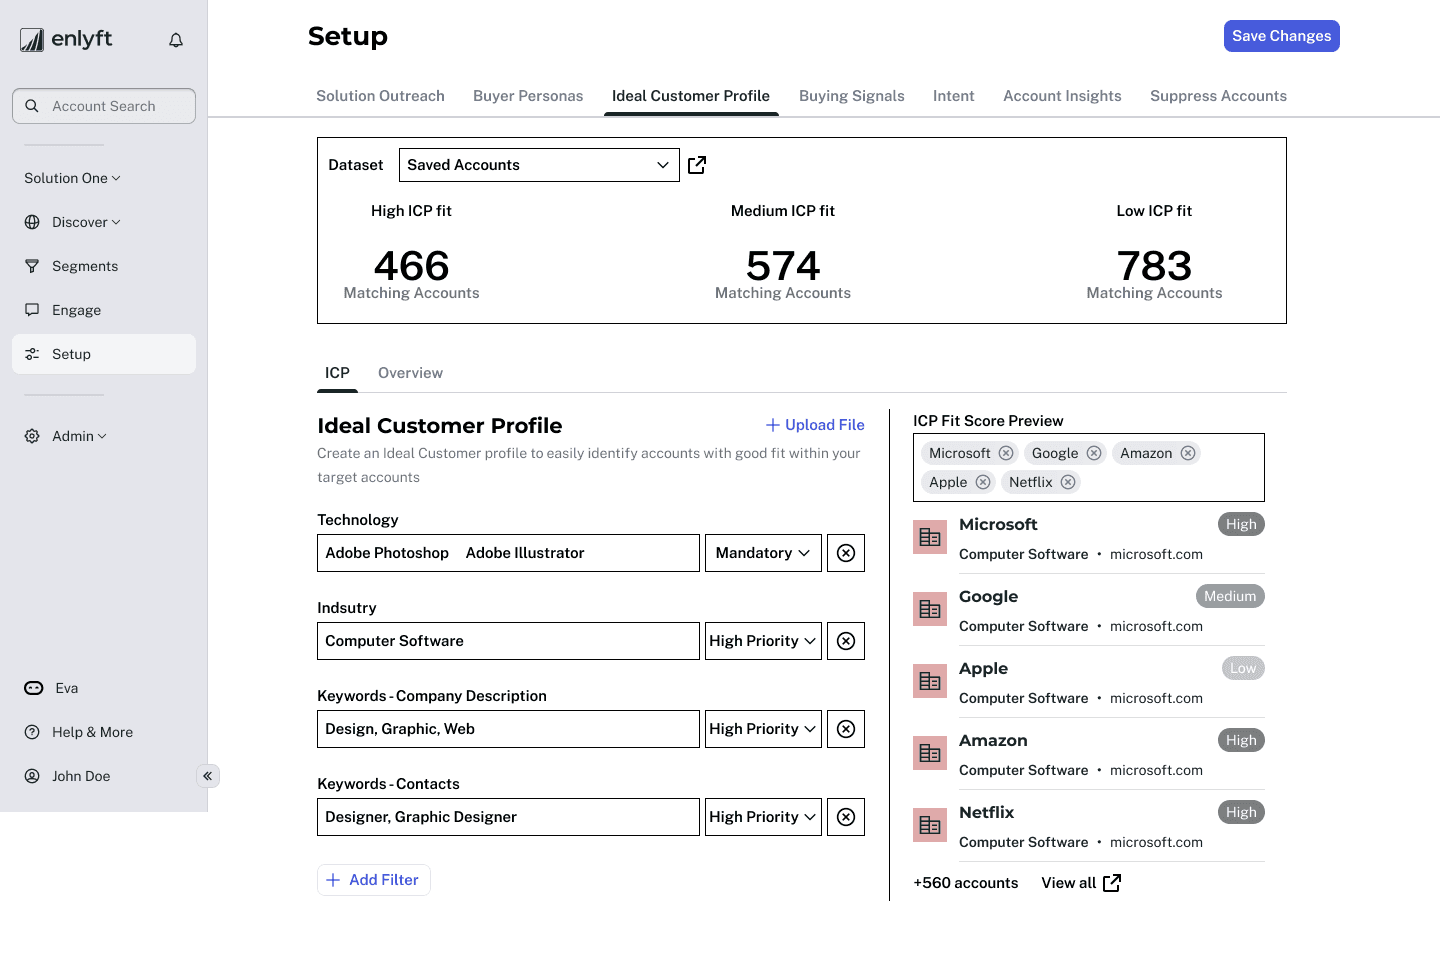
Account Fit Distribution and Score Preview
Once users set criteria like location, industry, and technologies, they can immediately see the total number of accounts that match their TAM and ICP, along with a fit score for each account. If needed, users can adjust the scoring ranges to expand or narrow their results. For instance, if more accounts are required in the high-fit range, the sliders on the chart can be adjusted accordingly.
Key Features:
Account List Preview: Users can instantly preview the fit score by adding selected accounts or randomly chosen accounts.
List View

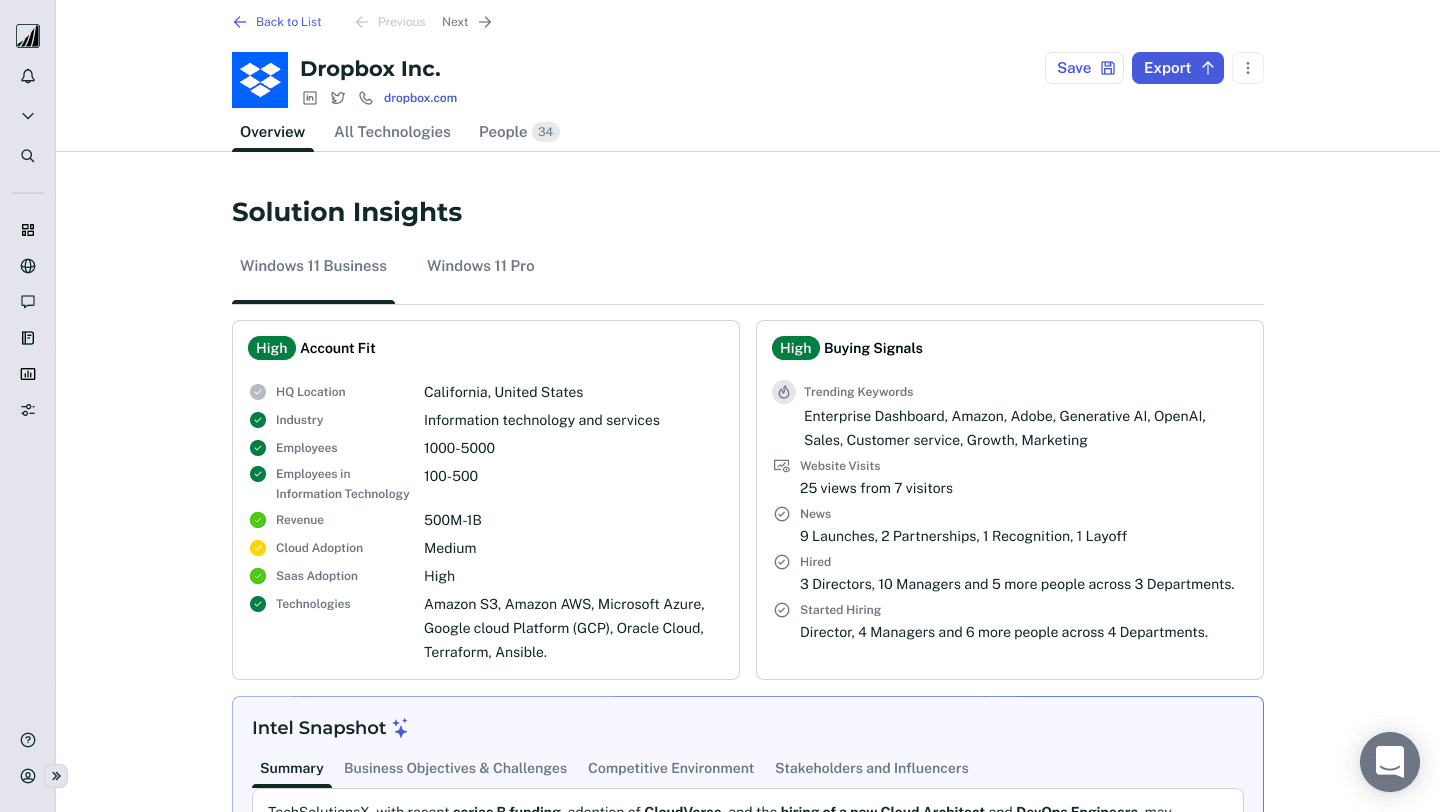
Company Profile Page
The company profile page displays data points of the criteria defined in Account Fit setup, each marked with color-coded icons to indicate whether they are a best match, medium match, fair match, or outside the TAM.
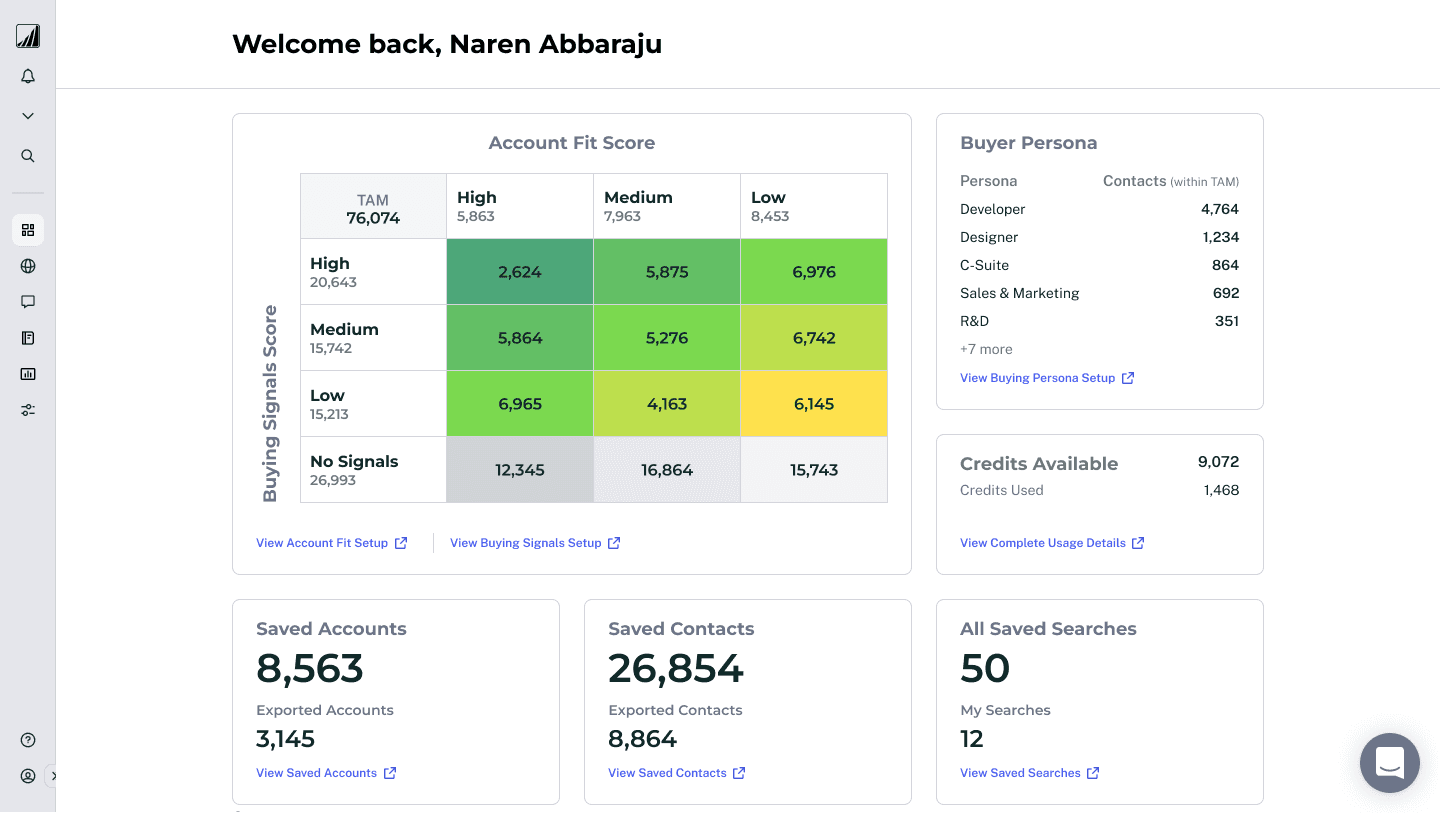
Dashboard
The Dashboard displays a matrix that combines the Account Fit score with the Buying Signals score. This helps users gain confidence in a company when both scores are high.